Question 12 marksEasier
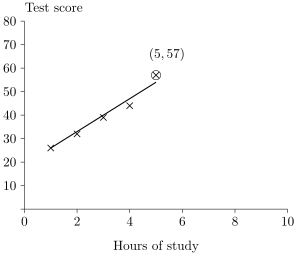
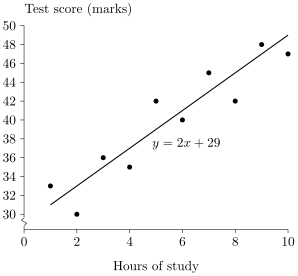
The scatter plot shows the number of hours students studied and their test scores, with the line of best fit and its equation. The line rises by marks for every extra hour of study. Use the equation of the line to estimate the number of hours of study that gives a test score of marks.
Worked solution
From the diagram the line of best fit is .
Put : , so and .
Answer
Marking guidelines
Reads the equation of the line of best fit from the diagram | 1 mark |
Substitutes the test score and solves for the number of hours | 1 mark |
Report a problem with this question.