
Year 11 Mathematics Standard

Display and interpret grouped and ungrouped data

Two worked questions, each with its solution and marking guidelines. Tutors: get a whole lesson sheet on this topic, made for your student.

  • Questions at easy and medium levels
  • As short answer and multiple choice
  • Some with diagrams
  • New numbers every time, from 5,000+ templates across NSW Years 7 to 12
For tutors

Get a free lesson sheet

Made for your student, on any topic in Year 11 Mathematics Standard, with worked solutions and a marking guide. By email, in under a minute.

  • Their name on their copy
  • Easy, medium or hard
  • No account needed
Get my free sheet

Two worked examples

Question 12 marksMedium

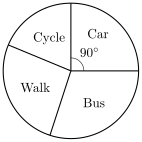
The pie chart shows how the students in a survey travel to school. The angle at the centre of the Car sector is 90∘90^\circ, as marked. 3030 students travel by car. How many students were surveyed altogether?
Figure

Worked solution

The Car sector is 90∘90^\circ of 360∘360^\circ, which is the fraction 90360\dfrac{90}{360} of all students.

Total =30×36090=120=\dfrac{30\times 360}{90}=120 students.

Answer

120120

Marking guidelines

Writes the car sector as a fraction of the whole circle using the angle shown

1 mark

Uses this fraction with the number of car students to find the total

1 mark

Report a problem with this question.

Question 23 marksMedium

The distances that a group of cyclists rode in one week are shown in the frequency table.

Distance (km)20–2425–2930–3435–39Frequency1317910\begin{array}{c|cccc} \text{Distance (km)} & 20\text{--}24 & 25\text{--}29 & 30\text{--}34 & 35\text{--}39 \\ \hline \text{Frequency} & 13 & 17 & 9 & 10 \end{array}

Use class centres to estimate the mean distance ridden, correct to 1 decimal place.

Worked solution

class centres are 22, 27, 32, 37\text{class centres are } 22,\ 27,\ 32,\ 37

∑fx=13(22)+17(27)+9(32)+10(37)=1403\sum fx = 13(22) + 17(27) + 9(32) + 10(37) = 1403

n=13+17+9+10=49n = 13 + 17 + 9 + 10 = 49

xˉ≈140349≈28.6\bar{x} \approx \frac{1403}{49} \approx 28.6

Answer

28.628.6

Marking guidelines

Uses the class centre of each interval to represent its scores

1 mark

Finds the sum of each class centre multiplied by its frequency and the total frequency

1 mark

Divides to estimate the mean and rounds correctly

1 mark

Report a problem with this question.

Not affiliated with NESA.