
Year 12 Mathematics Standard 1

Graphs of practical situations

Two worked questions, each with its solution and marking guidelines.

  • Questions at easy and medium levels
  • As short answer and multiple choice
  • Some with diagrams
  • New numbers every time, from 5,000+ templates across NSW Years 7 to 12

Two worked examples

Question 12 marksMedium

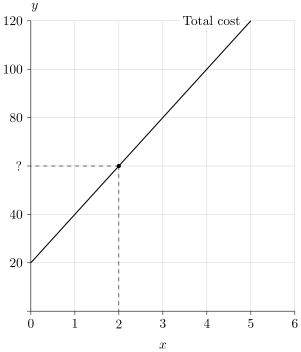
The graph shows the total cost, yy dollars, of hiring a kayak for xx hours. A group hires a kayak for 22 hours and shares the total cost equally among 44 people. Use the graph to find how much each person pays.
Figure

Worked solution

From the graph, the total cost for 2 hours is 6060 dollars.

Each person pays 60÷4=1560\div 4=15 dollars.

Answer

1515

Marking guidelines

Reads the total cost from the graph

1 mark

Divides the total cost equally

1 mark

Report a problem with this question.

Question 23 marksMedium

The depth dd centimetres of water in a rainwater tank is a linear function of the time tt hours since it started to rain. The depth was measured at two times.

Time, t (hours)14Depth, d (cm)1741\begin{array}{c|cc} \text{Time, } t \text{ (hours)} & 1 & 4 \\ \hline \text{Depth, } d \text{ (cm)} & 17 & 41 \end{array}

Using the linear model, find the depth of water, in centimetres, after 6 hours.

Worked solution

m=41−174−1=8m = \dfrac{41 - 17}{4 - 1} = 8

17=8(1)+b17 = 8(1) + b, so b=9b = 9

d=8(6)+9=57d = 8(6) + 9 = 57

Answer

5757

Marking guidelines

Finds the gradient of the line from the two data points

1 mark

Finds the vertical intercept and writes the equation of the model

1 mark

Substitutes the required time into the model to find the depth

1 mark

Report a problem with this question.

Not affiliated with NESA.