
Question 12 marksMedium
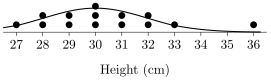
The dot plot shows the heights, in cm, of a sample of plants. The normal curve drawn over it has mean cm and standard deviation cm. Find the -score of the plant whose height is furthest from the mean.
Worked solution
The tallest plant, cm, is cm above the mean, which is further from the mean than the shortest plant ( cm, only cm below it).
.
Answer
Marking guidelines
Reads the heights from the dot plot and identifies the value furthest from the mean | 1 mark |
Substitutes into the -score formula and evaluates | 1 mark |
Report a problem with this question.