
Year 8 Mathematics

Rates, best buys, speed and distance-time graphs

Two worked questions, each with its solution and marking guidelines.

  • Questions at easy and medium levels
  • As short answer and multiple choice
  • Some with diagrams
  • New numbers every time, from 5,000+ templates across NSW Years 7 to 12

Two worked examples

Question 11 markMedium

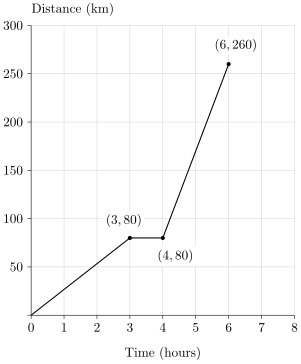
Matilda and Sione go to an away game with the cricket club. A distance-time graph of the bus trip has three straight sections. In the first section the bus travels 80 km in 3 hours. In the second section the line is horizontal, and this section lasts exactly 1 hour. In the third section the bus travels a further 180 km in 2 hours.

What is the average speed of the bus for the whole trip, in km/h? Give your answer correct to 2 decimal places.
Figure

Worked solution

Total distance: 80+180=26080 + 180 = 260 km.

Total time, including the horizontal section: 3+1+2=63 + 1 + 2 = 6 hours.

Average speed: 260÷6=1303≈43.33260 \div 6 = \dfrac{130}{3} \approx 43.33 km/h.

Answer

43.3343.33

Marking guidelines

Adds the distances, adds all the times including the horizontal section, and divides the total distance by the total time.

1 mark

Report a problem with this question.

Question 22 marksMedium

Maya has ordered some art supplies. The delivery driver, Jack, drives 18 km to her home at an average speed of 45 km/h. How many minutes does the drive take?

Worked solution

Time in hours =18÷45=1845=25= 18 \div 45 = \dfrac{18}{45} = \dfrac{2}{5}

Time in minutes =1845×60=24= \dfrac{18}{45} \times 60 = 24

Answer

2424

Marking guidelines

Divides the distance by the speed to find the time in hours

1 mark

Converts the time from hours to minutes

1 mark

Report a problem with this question.

Not affiliated with NESA.