Year 10 Mathematics

Graphs of constant and changing rates

Two worked questions, each with its solution and marking guidelines.

  • Questions at easy and medium levels
  • As short answer and multiple choice
  • Some with diagrams
  • New numbers every time, from 5,000+ templates across NSW Years 7 to 12

Two worked examples

Question 11 markMedium

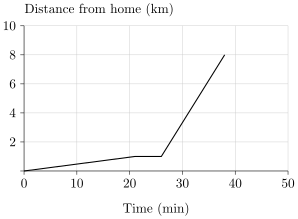
On the way to school, as shown on the distance-time graph, Priya walks 1 km from home, taking 21 minutes. She then takes a 5-minute break (shown by the flat section of the graph), before her neighbour drives her the remaining 7 km to school, which takes 12 minutes. Find her average speed for the whole journey (including the break), in km/h. Give your answer correct to 1 decimal place.
Figure

Worked solution

Her walking speed is 121×60\dfrac{ 1 }{ 21 }\times60 km/h and her driven speed is 712×60\dfrac{ 7 }{ 12 }\times60 km/h, which is faster, consistent with the steeper section of the graph.

Total distance =1+7=1+7 km and total time (including the break) =(21+5+12)=(21+5+12) minutes, so the average speed is 1+7(21+5+12)/60≈12.6\dfrac{ 1+7 }{(21+5+12)/60}\approx 12.6 km/h.

Answer

12.612.6

Marking guidelines

Divides the total distance by the total time, including the break, to find the average speed

1 mark

Report a problem with this question.

Question 23 marksMedium

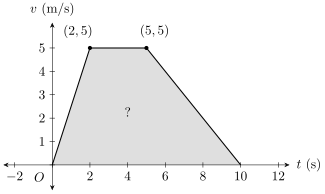
The diagram shows the velocity-time graph of a train over its whole journey. The train reaches its top speed of 55 m/s at t=2t=2 s, holds that speed until t=5t=5 s, and comes to rest at t=10t=10 s (time in seconds, velocity in m/s). Using the area under the graph, find the total distance the train travels.

Figure

Worked solution

From the diagram the train speeds up to 55 m/s at 22 s, holds that speed until 55 s, then slows to rest at 1010 s.

Areas: 2×52=5\dfrac{ 2\times 5 }{2}=5, 3(5)=153(5)=15 and 5×52=12.5\dfrac{ 5\times 5 }{2}=12.5.

Total distance =5+15+12.5=32.5=5+ 15+ 12.5=32.5 m.

Answer

32.532.5

Marking guidelines

Splits the area under the graph into a triangle, a rectangle and a triangle, using the diagram

1 mark

Finds the area of each shape

1 mark

Adds the areas to find the total distance

1 mark

Report a problem with this question.

Not affiliated with NESA.