Year 12 Mathematics Standard 2

Network flow

Two worked questions, each with its solution and marking guidelines. Tutors: get a whole lesson sheet on this topic, made for your student.

  • Questions at easy and medium levels
  • As short answer and multiple choice
  • Some with diagrams
  • New numbers every time, from 5,000+ templates across NSW Years 7 to 12
For tutors

Get a free lesson sheet

Made for your student, on any topic in Year 12 Mathematics Standard 2, with worked solutions and a marking guide. By email, in under a minute.

  • Their name on their copy
  • Easy, medium or hard
  • No account needed
Get my free sheet

Two worked examples

Question 13 marksMedium

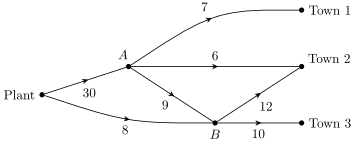
The diagram shows a power network with one power plant, two switching stations AA and BB, and three towns. Power can flow only in the direction of the arrows. The capacity of each line, in megawatts (MW), is given in the table, where, for example, AA-BB is the line that leaves AA and arrives at BB.

LinePlant-APlant-BA-Town 1A-Town 2A-BB-Town 2B-Town 3Capacity (MW)3087691210\begin{array}{c|ccccccc} \text{Line} & \text{Plant-}A & \text{Plant-}B & A\text{-Town 1} & A\text{-Town 2} & A\text{-}B & B\text{-Town 2} & B\text{-Town 3} \\ \hline \text{Capacity (MW)} & 30 & 8 & 7 & 6 & 9 & 12 & 10 \end{array}

Find the largest total power, in MW, that the network can deliver to the three towns together. (Diagram not to scale.)
Figure

Worked solution

Cuts that separate the plant from the three towns: round the plant alone, 30+8=3830+ 8=38; round the plant and AA, 7+6+9+8=307+ 6+ 9+ 8=30; round the plant and BB, 30+12+10=5230+ 12+ 10=52; round the plant, AA and BB, 7+6+12+10=357+ 6+ 12+ 10= 35.

By the maximum-flow minimum-cut theorem, the largest total flow equals the smallest cut capacity, which is 3030 MW.

Answer

3030

Marking guidelines

Identifies cuts that separate the plant from all three towns, counting only lines that leave the plant side

1 mark

Finds the capacity of each cut by adding the capacities of the lines it crosses

1 mark

States that the maximum flow equals the smallest cut capacity

1 mark

Report a problem with this question.

Question 22 marksEasier

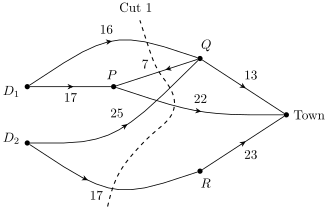
The diagram shows a pipe network in which two dams, Dam 1 and Dam 2, supply water to a town through junctions PP, QQ and RR. Water flows only in the direction of the arrows. The capacity of each pipe, in megalitres per day (ML/day), is given in the table, where D1D_1 and D2D_2 stand for Dam 1 and Dam 2 and, for example, QPQP is the pipe that leaves QQ and arrives at PP.

PipeD1PD1QD2QD2RP-TownQPQ-TownR-TownCapacity (ML/day)171625172271323\begin{array}{c|cccccccc} \text{Pipe} & D_1P & D_1Q & D_2Q & D_2R & P\text{-Town} & QP & Q\text{-Town} & R\text{-Town} \\ \hline \text{Capacity (ML/day)} & 17 & 16 & 25 & 17 & 22 & 7 & 13 & 23 \end{array}

A cut, labelled Cut 1, is drawn on the diagram. Find the capacity of Cut 1, in ML/day. (Diagram not to scale.)

Figure

Worked solution

Cut 1 has Dam 1, Dam 2 and PP on the source side, and QQ, RR and the town on the other. The pipes that cross it from the source side are D1QD_1Q, D2QD_2Q, D2RD_2R and PP-Town. Pipe QPQP runs from the far side back to the source side, so it is not counted.

Capacity of Cut 1 =16+25+17+22=80=16+ 25+ 17+ 22=80 ML/day.

Answer

8080

Marking guidelines

Identifies the pipes that cross the cut from the source side to the sink side and leaves out the pipe that crosses the other way

1 mark

Adds the capacities of those pipes

1 mark

Report a problem with this question.

Not affiliated with NESA.