
Question 12 marksMedium
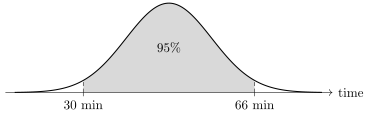
Waiting times at a clinic are normally distributed. In the diagram, the shaded region holds of the waiting times and extends from minutes to minutes. Use the 68-95-99.7 rule to find the standard deviation of the waiting times.
Worked solution
The shaded region holds of the data, so it spans standard deviations either side of the mean: its width is .
, so minutes.
Answer
Marking guidelines
Recognises the shaded region spans two standard deviations either side of the mean, so its width is four standard deviations | 1 mark |
Divides the width of the region by four to find the standard deviation | 1 mark |
Report a problem with this question.