Year 12 Mathematics Standard 2

Scatter plots and lines of best fit

Two worked questions, each with its solution and marking guidelines. Tutors: get a whole lesson sheet on this topic, made for your student.

  • Questions at easy and medium levels
  • As short answer and multiple choice
  • Some with diagrams
  • New numbers every time, from 5,000+ templates across NSW Years 7 to 12
For tutors

Get a free lesson sheet

Made for your student, on any topic in Year 12 Mathematics Standard 2, with worked solutions and a marking guide. By email, in under a minute.

  • Their name on their copy
  • Easy, medium or hard
  • No account needed
Get my free sheet

Two worked examples

Question 12 marksMedium

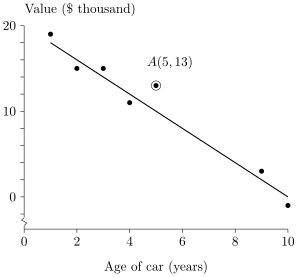
The scatter plot shows the age, xx years, and the value, yy thousand dollars, of a group of used cars. The line of best fit is drawn and has equation y=20−2xy=20-2x. Car AA is 55 years old and is labelled on the diagram with its age and its value. The residual for a car is its actual value minus the value predicted by the line of best fit. Find the residual for car AA.

Figure

Worked solution

Reading the diagram, car AA has a value of 1313 thousand dollars at 55 years. The line predicts y=20−2(5)=10y=20-2(5)=10.

Residual =13−10=3=13-10=3 thousand dollars.

Answer

33

Marking guidelines

Uses the equation of the line to find the predicted value at the age of car A

1 mark

Subtracts the predicted value from the actual value shown in the diagram

1 mark

Report a problem with this question.

Question 23 marksMedium

Five pairs of values are recorded for a household over five consecutive months, where xx is the monthly electricity cost in dollars and yy is the monthly gas cost in dollars. The pairs (x,y)(x, y) are (36,122)(36, 122), (56,160)(56, 160), (66,199)(66, 199), (36,142)(36, 142) and (86,232)(86, 232). Find the equation of the least squares regression line of yy on xx, giving the gradient and the intercept each correct to 2 decimal places, in the form y=bx+ay = bx + a.

Worked solution

Enter the five (x,y) pairs into the two‑variable statistics mode; the value 36 occurs twice, so input it for both corresponding months.

Compute the required sums: n = 5, Σx\Sigma x = 280, Σy\Sigma y = 855, Σxy\Sigma xy = 51550, Σx2\Sigma x^2 = 17480.

The calculator then yields the unrounded slope b≈2.039b \approx 2.039 and intercept a≈56.822a \approx 56.822.

Rounded to two decimal places the gradient is 2.04 and the intercept is 56.82, so the fitted line is y=2.04x+56.82y = 2.04x + 56.82.

Answer

y=2.04x+56.82y = 2.04x + 56.82

Marking guidelines

Enters all five pairs correctly, including the repeated explanatory value

1 mark

Gradient correct to the stated number of decimal places

1 mark

Intercept correct and the equation written in the form y = bx + a

1 mark

Report a problem with this question.

Not affiliated with NESA.