Year 9 Mathematics

Venn diagrams, two-way tables and set notation

Two worked questions, each with its solution and marking guidelines.

  • Questions at easy and medium levels
  • As short answer and multiple choice
  • Some with diagrams
  • New numbers every time, from 5,000+ templates across NSW Years 7 to 12

Two worked examples

Question 11 markMedium

A survey asked each of 50 adults whether they own a bicycle and whether they own a car. Some of the results are shown in the table.

CarNo carTotalBike1020No bikeTotal2050\begin{array}{l|c|c|c} & \text{Car} & \text{No car} & \text{Total} \\ \hline \text{Bike} & 10 & & 20 \\ \text{No bike} & & & \\ \hline \text{Total} & 20 & & 50 \end{array}

One of these adults is chosen at random. Find the probability that the adult owns neither a bicycle nor a car, as a fraction in lowest terms.

Worked solution

Cells in the bike row and the car column: bike and no car =20−10=10= 20 - 10 = 10; car and no bike =20−10=10= 20 - 10 = 10.

No bike and no car =50−20−10=20= 50 - 20 - 10 = 20.

P(neither)=2050=25P(\text{neither}) = \dfrac{20}{50} = \dfrac{2}{5}.

Answer

25\dfrac{2}{5}

Marking guidelines

Completes the table and divides the count owning neither by the total, giving a fraction in lowest terms

1 mark

Report a problem with this question.

Question 22 marksMedium

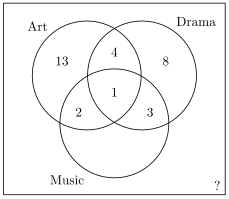
The Venn diagram shows how many students in a year group study each combination of Art, Drama and Music. The Music-only region is not labelled: 1010 students study only Music. There are 5050 students in the year group altogether. How many of them study none of these three subjects?

Figure

Worked solution

Students in the seven regions: 13+8+4+2+3+1+10=4113+ 8+ 4+ 2+ 3+ 1+ 10=41.

Students in none of the subjects: 50−41=950-41=9.

Answer

99

Marking guidelines

Adds the numbers in the seven regions, including the Music-only count from the question

1 mark

Subtracts this total from the number of students in the year group

1 mark

Report a problem with this question.

Not affiliated with NESA.