Year 7 Mathematics

Types of data, and drawing and reading graphs and tables

Two worked questions, each with its solution and marking guidelines.

  • Questions at easy and medium levels
  • As short answer
  • Some with diagrams
  • New numbers every time, from 5,000+ templates across NSW Years 7 to 12

Two worked examples

Question 13 marksMedium

The heights of some Year 7 students are shown in the grouped frequency table. Height (cm)130–139140–149150–159160–169Number of students79155\begin{array}{c|cccc} \text{Height (cm)} & 130\text{--}139 & 140\text{--}149 & 150\text{--}159 & 160\text{--}169 \\ \hline \text{Number of students} & 7 & 9 & 15 & 5 \end{array} What percentage of the students are shorter than 150 cm? Give your answer correct to the nearest whole percent.

Worked solution

Total number of students =7+9+15+5=36= 7 + 9 + 15 + 5 = 36.

Students shorter than 150 cm are in the first two groups: 7+9=167 + 9 = 16.

Percentage =1636×100≈44%= \dfrac{16}{36} \times 100 \approx 44\%.

Answer

44%44\%

Marking guidelines

Adds all four frequencies to find the total

1 mark

Adds the frequencies of the groups below 150 cm

1 mark

Divides by the total and gives a percentage to the nearest whole percent

1 mark

Report a problem with this question.

Question 22 marksMedium

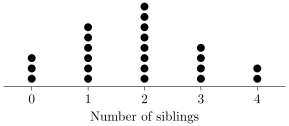
The dot plot shows the number of siblings each student in a class has. Each dot is one student. What fraction of the students have at least 33 siblings? Give your answer as a fraction in simplest form.

Figure

Worked solution

Add the dots: 3+6+8+4+2=233 + 6 + 8 + 4 + 2 = 23 students in the class.

Students with at least 33 siblings: add the dots in the columns from 33 upwards to get 66 students.

Fraction =623= \dfrac{6}{23}.

Answer

623\dfrac{6}{23}

Marking guidelines

Finds the total number of students from the dot plot

1 mark

Counts the students with at least the given number of siblings and writes the fraction

1 mark

Report a problem with this question.

Not affiliated with NESA.