
Year 9 Mathematics

Measures of centre and spread, quartiles and box plots

Two worked questions, each with its solution and marking guidelines.

  • Questions at easy and medium levels
  • As short answer and multiple choice
  • Some with diagrams
  • New numbers every time, from 5,000+ templates across NSW Years 7 to 12

Two worked examples

Question 12 marksMedium

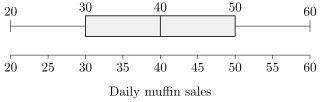
The box plot for a bakery's daily muffin sales, recorded over several weeks, has minimum 2020, lower quartile 3030, median 4040, upper quartile 5050 and maximum 6060. An outlier is defined as any value lying more than 1.51.5 times the interquartile range above the upper quartile; calculate this upper outlier fence.
Figure

Worked solution

The interquartile range is IQR=Q3−Q1=50−30=20\text{IQR}=Q_3-Q_1=50-30=20.

The upper outlier fence equals Q3+1.5×IQR=50+1.5×20=80Q_3+1.5\times\text{IQR}=50+1.5\times20=80.

Answer

8080

Marking guidelines

Calculates the interquartile range from the upper and lower quartiles

1 mark

Determines the upper outlier fence by adding one and a half times the interquartile range to the upper quartile

1 mark

Report a problem with this question.

Question 22 marksMedium

Fifteen scores, listed in ascending order, are: 0, 15, 20, 25, 28, 31, 34, 37, 40, 43, 46, 49, 51, 54, 58. Find the interquartile range of this data set.

Worked solution

With 1515 scores, the lower quartile Q1Q_1 is the fourth score and the upper quartile Q3Q_3 is the twelfth score, when listed in ascending order.

Q1=25Q_1=25 and Q3=49Q_3=49, so the interquartile range is IQR=Q3−Q1=49−25=24IQR=Q_3-Q_1=49-25= 24.

Answer

2424

Marking guidelines

Identifies the lower quartile as the fourth score and the upper quartile as the twelfth score

1 mark

Finds the correct interquartile range

1 mark

Report a problem with this question.

Not affiliated with NESA.