Year 9 Mathematics

Sampling, grouped data and statistical investigations

Two worked questions, each with its solution and marking guidelines.

  • Questions at easy and medium levels
  • As short answer and multiple choice
  • Some with diagrams
  • New numbers every time, from 5,000+ templates across NSW Years 7 to 12

Two worked examples

Question 13 marksMedium

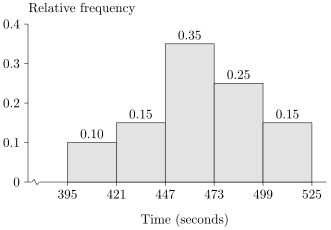
The relative frequency histogram shows the times, in seconds, taken by a group of athletes to run a race. Every class is 2626 seconds wide. There are 3535 athletes in the modal class (the class with the tallest bar). How many athletes took less than 473473 seconds?

Figure

Worked solution

The modal class has relative frequency 0.350.35, so the total number of athletes is 350.35=100\dfrac{35}{0.35}=100.

Athletes who took less than 473473 seconds are in the first three classes: relative frequency 0.1+0.15+0.35=0.60.1+0.15+0.35=0.6.

Number of athletes =100×0.6=60=100\times 0.6=60.

Answer

6060

Marking guidelines

Reads the relative frequency of the modal class and uses it to find the total number of athletes

1 mark

Adds the relative frequencies of the classes below the boundary

1 mark

Multiplies the total number of athletes by this relative frequency

1 mark

Report a problem with this question.

Question 22 marksMedium

A school has 150150 boys and 250250 girls. A stratified random sample of 4040 students is chosen, with the number from each group in proportion to its size. How many boys are in the sample?

Worked solution

Total number of students =150+250=400= 150 + 250 = 400

Number of boys in the sample =150400×40= \dfrac{150}{400} \times 40

=15= 15

Answer

1515

Marking guidelines

Finds the total number of students

1 mark

Multiplies the sample size by the boys' share of the students and calculates

1 mark

Report a problem with this question.

Not affiliated with NESA.